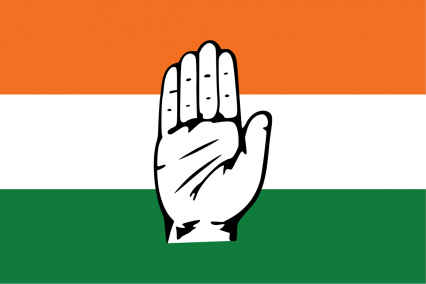
The Republic of Indian National Congress
Jai Jawan, Jai Kisan!
Region: The North Pacific
Quicksearch Query: Indian National Congress
|
Quicksearch: | |
NS Economy Mobile Home |
Regions Search |
Indian National Congress NS Page |
|
| GDP Leaders | Export Leaders | Interesting Places BIG Populations | Most Worked | | Militaristic States | Police States | |

Jai Jawan, Jai Kisan!
Region: The North Pacific
Quicksearch Query: Indian National Congress
| Indian National Congress Domestic Statistics | |||
|---|---|---|---|
| Government Category: | Republic | ||
| Government Priority: | Education | ||
| Economic Rating: | Fair | ||
| Civil Rights Rating: | Good | ||
| Political Freedoms: | Excellent | ||
| Income Tax Rate: | 24% | ||
| Consumer Confidence Rate: | 100% | ||
| Worker Enthusiasm Rate: | 103% | ||
| Major Industry: | Book Publishing | ||
| National Animal: | Lion | ||
| Indian National Congress Demographics | |||
| Total Population: | 302,000,000 | ||
| Criminals: | 33,658,877 | ||
| Elderly, Disabled, & Retirees: | 37,279,756 | ||
| Military & Reserves: ? | 6,857,281 | ||
| Students and Youth: | 55,930,400 | ||
| Unemployed but Able: | 48,144,274 | ||
| Working Class: | 120,129,412 | ||
| Indian National Congress Government Budget Details | |||
| Government Budget: | $446,412,146,355.73 | ||
| Government Expenditures: | $437,483,903,428.62 | ||
| Goverment Waste: | $8,928,242,927.11 | ||
| Goverment Efficiency: | 98% | ||
| Indian National Congress Government Spending Breakdown: | |||
| Administration: | $26,249,034,205.72 | 6% | |
| Social Welfare: | $87,496,780,685.72 | 20% | |
| Healthcare: | $52,498,068,411.43 | 12% | |
| Education: | $91,871,619,720.01 | 21% | |
| Religion & Spirituality: | $0.00 | 0% | |
| Defense: | $39,373,551,308.58 | 9% | |
| Law & Order: | $39,373,551,308.58 | 9% | |
| Commerce: | $17,499,356,137.14 | 4% | |
| Public Transport: | $26,249,034,205.72 | 6% | |
| The Environment: | $8,749,678,068.57 | 2% | |
| Social Equality: | $26,249,034,205.72 | 6% | |
| Indian National CongressWhite Market Economic Statistics ? | |||
| Gross Domestic Product: | $363,218,000,000.00 | ||
| GDP Per Capita: | $1,202.71 | ||
| Average Salary Per Employee: | $2,024.27 | ||
| Unemployment Rate: | 24.91% | ||
| Consumption: | $946,540,464,046.08 | ||
| Exports: | $158,522,802,176.00 | ||
| Imports: | $173,006,782,464.00 | ||
| Trade Net: | -14,483,980,288.00 | ||
| Indian National Congress Non Market Statistics ? Evasion, Black Market, Barter & Crime | |||
| Black & Grey Markets Combined: | $459,765,809,676.99 | ||
| Avg Annual Criminal's Income / Savings: ? | $1,016.34 | ||
| Recovered Product + Fines & Fees: | $31,034,192,153.20 | ||
| Black Market & Non Monetary Trade: | |||
| Guns & Weapons: | $10,996,965,989.49 | ||
| Drugs and Pharmaceuticals: | $27,492,414,973.71 | ||
| Extortion & Blackmail: | $12,218,851,099.43 | ||
| Counterfeit Goods: | $21,382,989,424.00 | ||
| Trafficking & Intl Sales: | $8,553,195,769.60 | ||
| Theft & Disappearance: | $21,993,931,978.97 | ||
| Counterfeit Currency & Instruments : | $23,826,759,643.88 | ||
| Illegal Mining, Logging, and Hunting : | $6,109,425,549.71 | ||
| Basic Necessitites : | $40,933,151,183.08 | ||
| School Loan Fraud : | $26,881,472,418.74 | ||
| Tax Evasion + Barter Trade : | $197,699,298,161.11 | ||
| Indian National Congress Total Market Statistics ? | |||
| National Currency: | rupee | ||
| Exchange Rates: | 1 rupee = $0.11 | ||
| $1 = 9.16 rupees | |||
| Regional Exchange Rates | |||
| Gross Domestic Product: | $363,218,000,000.00 - 44% | ||
| Black & Grey Markets Combined: | $459,765,809,676.99 - 56% | ||
| Real Total Economy: | $822,983,809,676.99 | ||
| The North Pacific Economic Statistics & Links | |||
| Gross Regional Product: | $570,507,480,954,568,704 | ||
| Region Wide Imports: | $72,615,192,462,098,432 | ||
| Largest Regional GDP: | Span | ||
| Largest Regional Importer: | Span | ||
| Regional Search Functions: | All The North Pacific Nations. | ||
| Regional Nations by GDP | Regional Trading Leaders | |||
| Regional Exchange Rates | WA Members | |||
| Returns to standard Version: | FAQ | About | About | 484,078,724 uses since September 1, 2011. | |
Version 3.69 HTML4. V 0.7 is HTML1. |
Like our Calculator? Tell your friends for us... |